thinkorSwim Chart Settings
ThinkorSwim offers a collection of tutorials for their chart settings customization. These settings include General, Price Axis, Time Axis, Appearance settings and more. It is here that ToS allows you to add/ toggle time frame aggregations which are important based on the type of trader you are. I typically add an expansion area and fill the Green ticks up on the Appearance tab. I find it helpful to also overlap volume on the chart (General Tab). Can also remove after hours to speed up backdating testing.

A watch list is a collection of symbols grouped together along with market data of respective instruments. Traders often make custom watchlists based on companies or derivatives they find interesting, but they can also be constituents of an index like NASDAQ 100, the Dow Jones Industrials, or the S&P 500, to name a few. Watch Lists are a key feature itself but have also found application in other thinkorswim features: Scanner, FX Global Currency Map, Stock Hacker, Use The News, and several others. In the gadget title, you can find four controls: the watch list selector, the up/down arrow control  , the 'clip' icon
  , and the Show actions button
  :
:
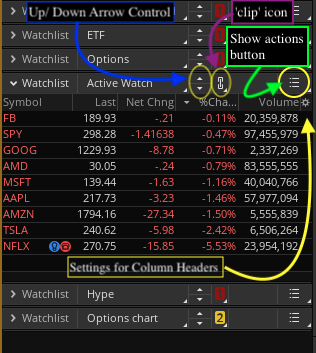
- The watchlist selector allows you to configure your watch lists. It is in the configuration menu that you can create, delete, and switch between the watch lists. Beside your personal watch lists, you can switch to any of the public, Lovers and losers, Top 10, and industry-based ones. In the same menu, you can also view your portfolio watch list, i.e., the watch list of symbols that have positions in the currently selected account.
- Arrows allow you to easily switch between watch lists in a group: the up arrow will take you to the previous watch list in the set, and down arrow will take you to the next.
- - Clip icon allows you to use the thinkorswim color-coded clipboard; it is a shortcut to link a component to another one. Clicking on the icon brings up a color-and-number selection menu. In this menu, you can click on a color so that your watch lists will be linked to all other thinkorswim components having the same color code. For example, choosing a green box will link all components that use green, even if they are in a different window. Tip: consider linking Watch Lists to the symbol selector and the Dashboard. This way, clicking through the watch list will automatically display corresponding symbols in the symbol selector and the Dashboard.
- (Scan to dynamic watchlist)(Adding Studies to Watchlist)
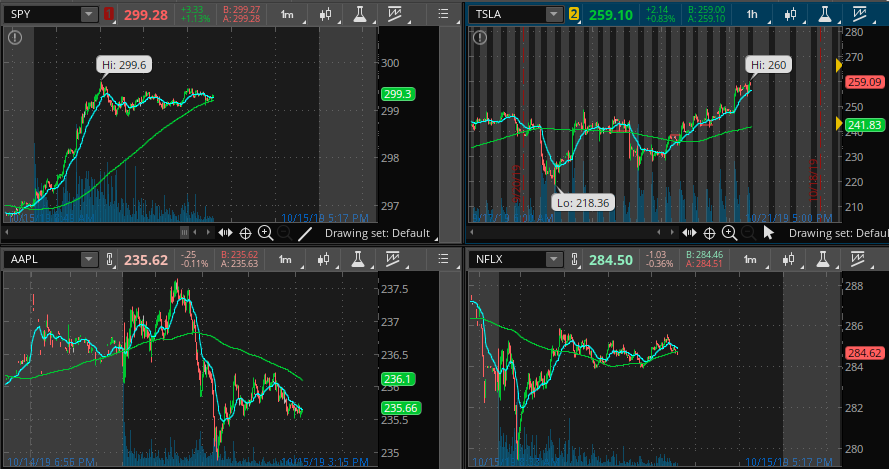
Ever want to display more than one chart in the form of a grid? How do you save certain studies or settings to quickly switch with ease? ToS allows you to customize your preferences by utilizing the various studies, drawings, and settings and saving their settings. You can save your chart layout by clicking on the grid drop down menu at the upper right of the page and selecting “Save Grid As …” You can also utilize this grid to choose how many charts you wish to display on the monitor. Within the Style dropdown box in the right corner, you are able to choose their aggregation type between Tick, Time and Range. Also, you can choose whether to record the chart either intraday or daily. Once determined, you can save the style within the same menu. Finally, you may employ any number and combination of drawings and studies and save these separately in the same way within each dropdown box.![]()
Alerts: There are 2 types of alerts available in ToS:
Platform alerts can be found on the Alerts section of the Marketwatch tab. Some script functions don’t work and in general it’s more limited than what you can write for a chart study. However you can send text or email if that’s enabled on the platform. A choice of sounds is available or a personalized audio file can also be played. TOS/platform doesn't have to be open (source)
Study-based alerts are programed as part of a thinkScript study loaded on the chart using the Alert() function. This type of alert can’t email or SMS/txt but will show up as a Platform Message and you will have an audible alert. A personalized audio file cannot be specified. Note that the platform has to be open. (source)
Study alerts: Study Alerts are a special feature that will alert you when a specified condition is fulfilled, should it be a price reaching a certain level, a relation between function values, or a study crossover. Both pre-defined and custom studies may be used in a study alert.
- To create a study alert, click the MarketWatch tab and choose Alerts from the sub-tab row. Type the symbol and click the Study alert button at the top-right. The Study Alerts window will appear.
- Now you are ready to create the condition upon which the alert will be triggered. This can be done using either the Condition Wizard or the standard thinkScript Editor.
- After the condition is set, several special rules can be added: the alert sound, the repetition of the alert, and date and time to activate the alert at. Click Set Alert Rules... in order to customize these additional rules.
- Once the condition and the rules are set, click Create alert. The alert will be displayed in your Alert Book. (source)
Regular alert: In order to set recurring alerts under Marketwatch -> Alerts, . check the box “Recreate alert for reverse crossover” in the Alert rules. That will keep the alert active after it triggers. Check the box to silence the alert, unless you’d like to be alerted about it. If this box is not checked it will only alert once. "Reverse Crossover" is really a poor name. What it means is the alert condition crossing from one to zero, or true to false. It is a reverse crossover, because when triggered it is crossing from zero to one. So when enabled, it will reset to false when the condition is no longer true, and this keeps it active. (source)
when you create each Alert, be sure to select Reverse Crossover = Regular Alert for Reverse Crossover. That way you only have to create each Alert once, and every time price crosses that level Alert will trigger (on platform and/or to email or phone) and will automatically re-set causing Alert lines to always be on your chart (if charts have "Show Alert" selected)
Setting Alert for Entire Watchlist: to set an alert for an entire watch list, you have to create a custom chart study with alert built into the ThinkScript for the custom chart study then open a grid of charts with each containing the custom study with alert, and click on top right Symbols to select the watch list (IMPORTANT - you can detach the grid and move it until almost off your screen but do NOT minimize (chart alerts will only trigger if chart is open, even if chart is hiding near edge of the screen))
DISCLAIMER: I AM NOT A CERTIFIED FINANCIAL ADVISOR AND NOTHING IN THIS VIDEO OR TEXT IS AN ADVERTISEMENT OR RECOMMENDATION TO BUY OR SELL ANY FINANCIAL INSTRUMENT. NOR IS THIS VIDEO OR TEXT INTENDED TO INSTRUCT YOU ON HOW TO MAKE BUY OR SELL DECISIONS USING ANY OF THESE INDICATORS OR STRATEGIES.